
June 10, 2024
Fix SHAP Multiclass Summary Plot – Downgrade to v0.44.1 from 0.45.0
Here’s a helpful tip for anyone using SHAP (SHapley Additive exPlanations):
If you’re trying to use `shap.summary_plot(shap_values, X_train_tfidf_dense, plot_type=”bar”)` for a multiclass summary, and it keeps showing a dotted interaction plot regardless of the plot type you pass; it’s likely a bug in `v0.45.0`.
Downgrading to v0.44.1 fixed it for me. Hope this saves someone time! 👍ExplainableAI
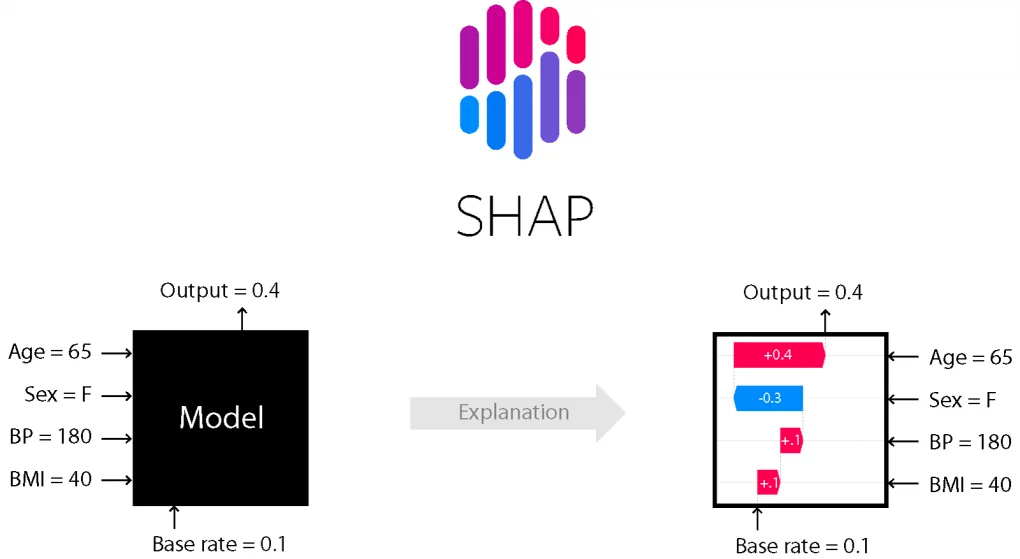
For those who don’t know what SHAP is, it’s a framework that can explain why your that specific prediction and what features contributed to that output.
SHAP (SHapley Additive exPlanations) is a game-theoretic approach to explaining the output of any machine learning model. It connects optimal credit allocation with local explanations using the classic Shapley values from game theory and their related extensions.
Below is a straightforward code to demonstrate the issue:
# Create a synthetic dataset
X, y = make_classification(n_samples=100, n_features=5, n_informative=3, n_redundant=1, n_clusters_per_class=1, n_classes=3, random_state=42)
features = [f"Feature {i}" for i in range(X.shape[1])]
X = pd.DataFrame(X, columns=features)

# Train a RandomForest model
model = RandomForestClassifier(n_estimators=50, random_state=42)
model.fit(X, y)

# Create the SHAP Explainer
explainer = shap.TreeExplainer(model)
shap_values = explainer.shap_values(X)

# Plot SHAP values for each class
shap.summary_plot(shap_values, X, plot_type="bar", class_names=['Class 0', 'Class 1', 'Class 2'])
Here are the screenshots for both versions:

